| - |
||||||||
 |
||||||||
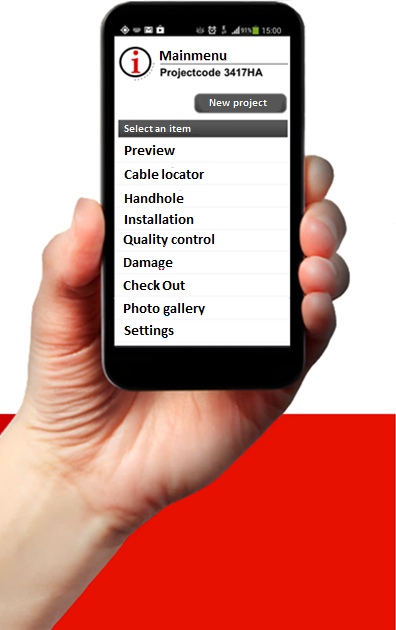
Key applications |
||||||||
Every company is different. So, simply tailor the system to your own needs. |
||||||||
 |
 |
 |
||||||
| Project monitoring | Locator Fleet Management | Damage reporting | ||||||
 |
 |
 |
||||||
| Check out | Object information | Quatlity control | ||||||
| Project monitoring | |||||
| Do you regularly work on project basis? If so, activate log categories like 'previews', 'project progress' and/or 'end-of-work'. All apps will immediately be synchronized. To log a situation, simply open the app, select the right log category, make pictures and enter data as instructed by the app. All information will automatically be linked to date/time/location, username and projectnumber and next be added on your secured company account on this website. No delays, no handling. Log in, select a project and i.e. ''previews'' and all previews of this project will immediately be shown.
 |
|||||
Locator Fleet Management |
|||||
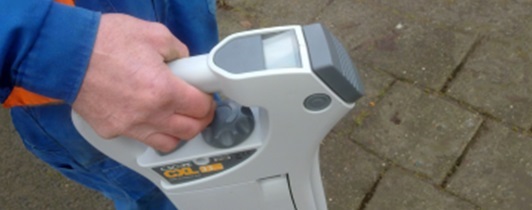
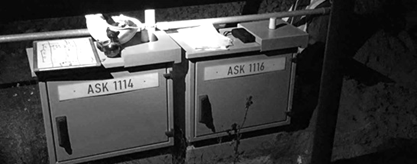
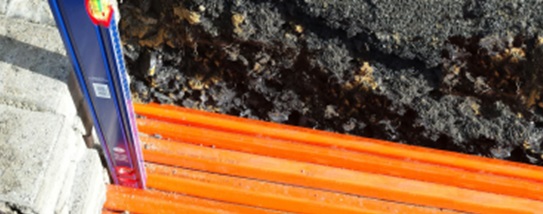
| When active in the Utility Maintenance Industry, ensuring safe digging practises is of key importance. CableTracks provides a fact based management tool to control the proper usage of cable locators When operating a fleet of datalogging locators, CableTracks helps transforming the individual locator data into information you can really use in your day-to-day operation.
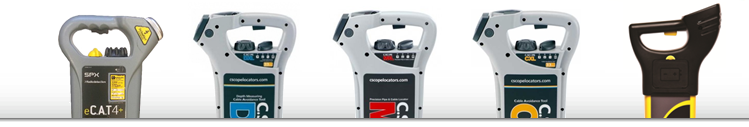
Collecting locator data CableTracks is an open system and connects to all popular datalogging locator models like eCAT4, gCAT4, C-Scope CXL2-DL / DXL2-DL / MXL2-DL and EzyCAT i700 / i750. So, whatever your fleet, CableTracks will provide an independant analyse of all locator usage. The exact method to transfer the datalogs to CableTracks depend on your locator model.
SiteMap for all details of one specific search (survey) CableTracks is specialized in visualizing locator usage. The system automatically organizes all data, such to give a full overview of all safe digging practises for a project (even if a variety of locators is involved, both for single day or a multi-day searches). To find a specific search, simply select a date, colleague, locator ID and/or map position. All relevant data will immediately shown on your screen, providing an objective proof, which - in case of a strike - can also be used for claim handling. |
|||||
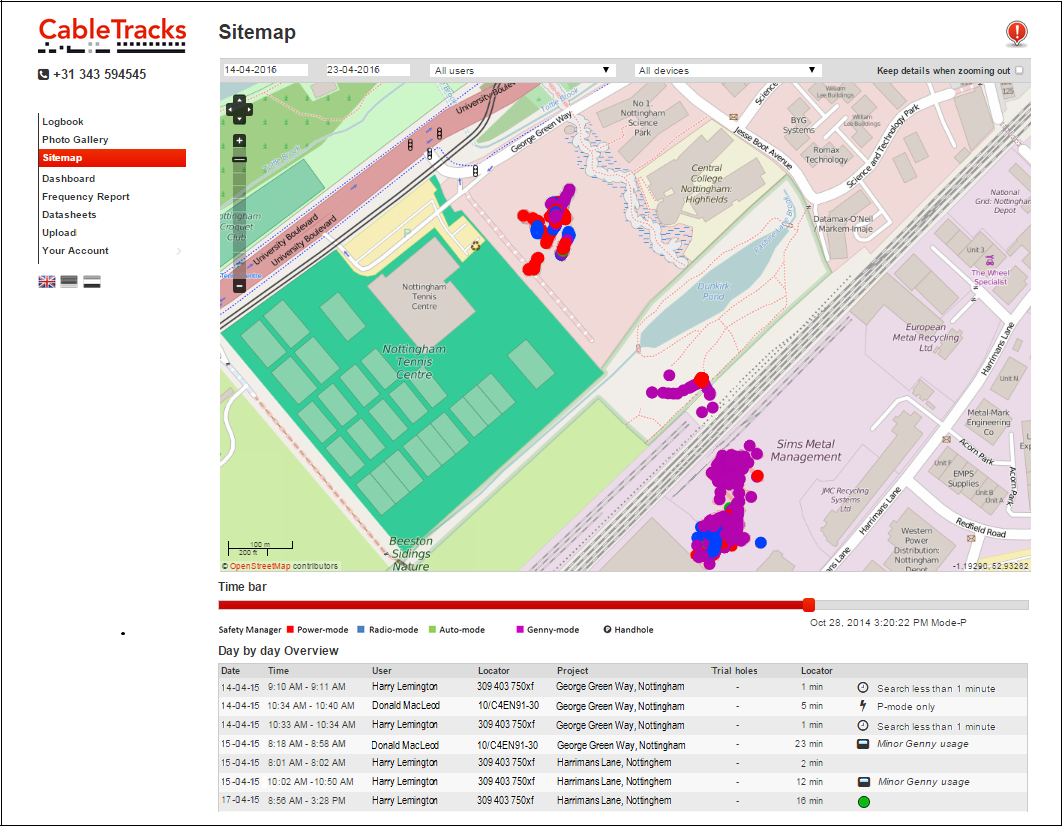 |
SiteMap shows all locator usage, which is presented with specific color codes for the Power mode, Radio mode, Auto mode and the Genny / Transmitter mode. SiteMap also shows the effective search time (in minutes). A Timebar allows to monitor the search from the start to the end. The day-to-day bottum table provides even more details, with a list of all colleagues involved, and the search details of each individual. If the locator was not properly used, clear remarks automatically show what went wrong (and which corrective action is required to improve future usage). . |
||||
 |
|||||
Dashboard for overall trends and to identify corrective action In case of a bigger locator fleet, the system provides an additional tool to control locator usage as, in practise, it will be very timeconsuming to study all individual searches (surveys). That is why the Dashboard (above right) automatically summarizes all usage in a period. A first graph shows the trend in the number of searches (surveys). By comparing the number of underground projects with this number, one gets a strong indication if the locators are sufficiently used. The Dashboard thus immediately shows if the locators are used for i.e. 60% of all underground works or 99% of such works. A next graph gives a clear indication of the average search quality. In May, for example, 60% of all searches might have been OK. In April, this percentage dropped to 55%, but in June, it raised to 70%. The percentage represents all searches (surveys) without any Alert. These alerts are automatically linked to a search (survey) if a value is extremely different from thousands of other searches (surveys) in the database (benchmark): |
|||||
 |
 |
 |
 |
 |
|
| Time alert Warns for surveys belows the minute. |
Power alert Warns for locator usage in power mode only, thus limiting traceability to power lines only. |
Genny alert Shown if a locator is used with minor transmitter usage only, thus limiting knowledge of depths and connections to the house. |
Speed alert Warns of the locator was used ''while running'', thus blocking real knowlegde of underground utilities. |
Scatter alert Shown if a survey was conducted in a scattered pattern only, thus possibly neglecting vital parts. |
|
By monitoring the Dashboard, actual locator usage is no longer a hidden practise. It helps to transfer Safety into a controled process. In case of weaknesses, drill-down functionality enables to quickly identify the target department(s), unit(s), supervisor(s) and/or individual operator(s) for corrective action. If needed the system also provides the exact raw data as downloaded from the locators. All information is processed, nothing gets lost. |
|||||
Upload Tool In order to ensure a reliable reporting on all locator usage, all locators must indeed be connected on a regular basis. Therefor, CableTracks offers the option to control and support the upload procedure. First, set an upload frequency (weekly, monthly, quarterly). All operators / supervisors who transferred datalogs in a prior period, will now automatically receive a reminder to do so again at the latest day of the current period. If an operator / supervisor is responsible for connecting a series of locators, the system will immediately show which locators still need to be connected, and which ones are OK. The system allows to activate another email service, for those locators which are not uploaded in time. . |
|||||
|
|||||
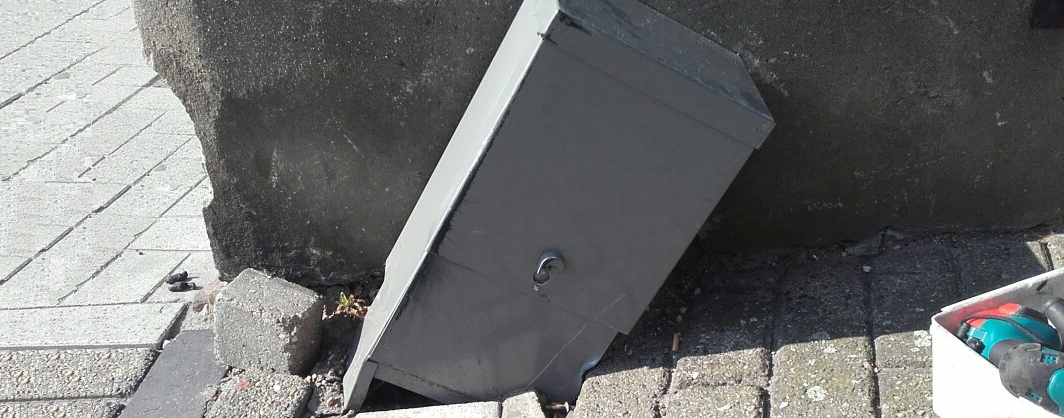
Damage reporting |
|||||
| In case of an incident, ensure the right information is logged and ensure this information is immediately forwarded to the backoffice. Use the CableTracks app to provide the exact right log categories and the right questionnaires to describe incidents like:
If needed, the report can be forwarded to i.e. your insurance agent. No delays, no lacking photos or information. All incidents are automatically stored. You will always have an up-to-date damage overview, which can be easily downloaded as an Excel document, i.e. for further processing. |
|||||
Check out |
|||||
| Service teams with short cycle jobs might be used to log their working hours on paper forms. However, a far more effective method is using the CableTracks app. It just takes a few steps to get started. First, specify the relevant job categories and identify to the information you need for each of those job categories. Contact CableTracks and we will add the listed job categories and the linked questionnaires overnight. That's all. Once a worker has finished a job, he/she only needs to open the CableTracks app, select the relevant job and perhaps answer some questions on materials used and next steps. All data are automatically linkjed to the right location and the right date/time. Log in at this website to have all times of all jobs of all workers available. The reports are downloaded in seconds, ready for futher processing. |
|||||
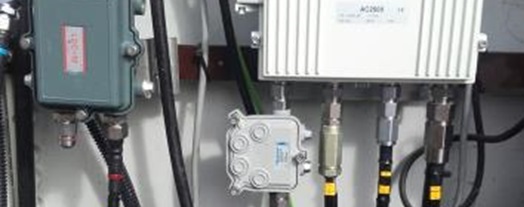
Object information |
|||||
| For Service and Maintenance organisations, it is key to be well informed of the key characteristics of the objects they are responsible for. If these objects are located at a variety of locations, one should think of how to collect the relevant data, and how to keep the data up-to-date. The CableTracks app might be a great help here. First, identify the relevant characteristics, such as position, sizings, materials, and functionality. Next, contact CableTracks in order to develop the appropriate questionnaires. From that moment onwards, any of your colleagues is enabled to make updates. Simply open the app and enter the data. All information from all colleagues is automatically organized and presented at this website. Log in and you will immediately see the location of your objects (mapping), the key characteristics and the photos. All data can also be downloaded to your own environment. |
|||||
Quality control |
|||||
| Inspections can be important at all kind of moments: when starting a project, upon arrival of materials needed, and at the end of a project. The CableTracks can be easily used to log if materials are deliverd as specified, and so forth. Once the CableTracks app is activated, simply select the right log category, and next screens will help to assess if a material or object is delivered in time and as specified. Tolerances can be measured and entered, damage can be reported. Photos might be added as proof. All logs are automatically send to the online company account at this website. All logs are stored for several years in a secured environment, so you will automatically have an archive with all reports. |
|||||